Mexico EnergyPARTNERS Request an assessment

MEP Virtual Energy Manager

Control industrial energy cost and risk across Mexico

Your electricity bill tells you what happened last month. MEP Virtual Energy Manager tells you why, who owns the fix, and what it is worth before the next bill closes.

37Facilities audited in Mexico
Since 2015Vendor-neutral energy advisor to industrial plants in Mexico
GDMTH + MEMCFE basic supply and qualified supply
2 business daysTo review one recent electricity bill
90 daysTo a controlled first site

The invoice arrives after the operating event

Monthly totals confirm cost after the conditions that created the variance have already passed.

  1. Production change

    Schedule or output changes

  2. Demand peak

    A short event sets the maximum

  3. Usage drift

    Base load or runtime moves

  4. Billing change

    A charge or adjustment appears

  5. Invoice posted

    The total is now historical

A monthly total cannot explain when the variance began, what caused it, or which team can correct it.

A shared record turns variance into control

Billing sees a charge. The plant sees a shift change. Finance sees a budget miss. It is the same variance.

SourceInputsAnswers
Billing and contractInvoices, meter references, price components, creditsWhat was charged
Meter and intervalConsumption, demand, time pattern, gapsWhen exposure occurred
OperationsSchedules, output, shutdowns, equipment eventsWhat changed at the facility
FinanceBudget, forecast, tolerances, approval thresholdsWhat requires action

ObserveExplainQuantifyAct

One view from portfolio cost to plant action

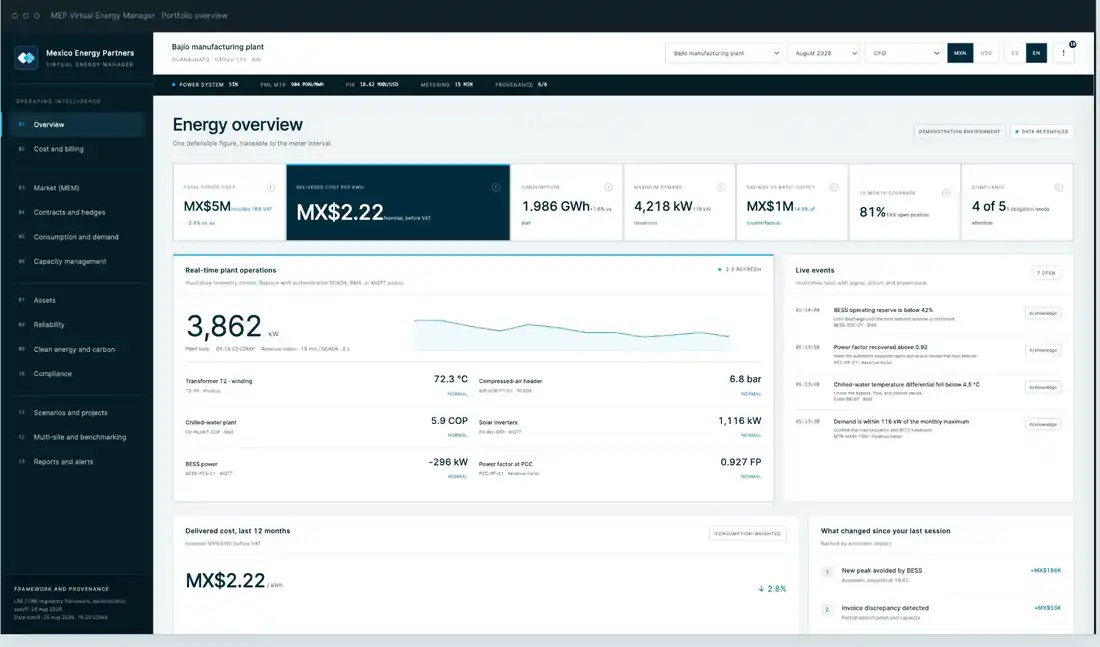
Management sees the economic position. Plant teams see the operating cause. Each material item remains traceable to its source.

MEP Virtual Energy Manager portfolio overview for a Bajío manufacturing plant: cost per kWh, consumption, demand, real-time plant operations, and live events
Illustrative platform view. Demonstration data does not represent client performance.

Four modules support one management record

Each module starts from a signal on the meter or the invoice and ends with a named owner and a closed action.

Cost and billing 1 / 4

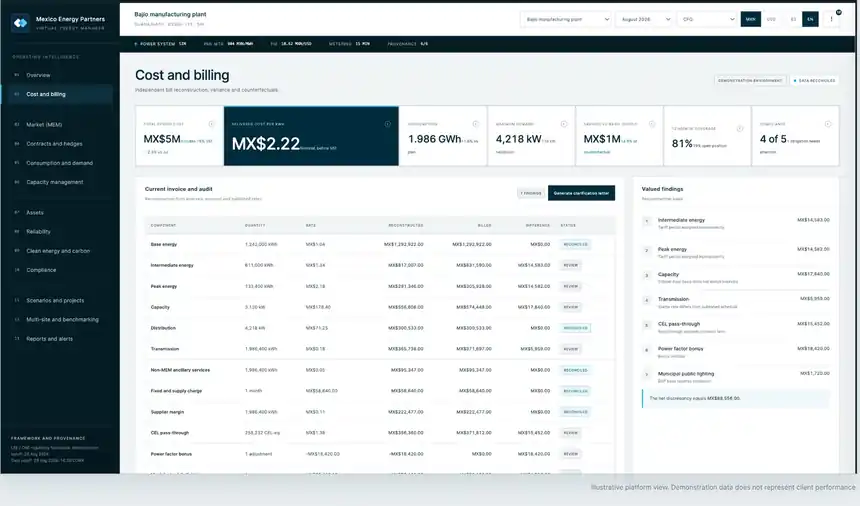
Reconstruct the bill before it closes

Compare billed charges with interval data, contract terms, and published rates. Route material differences to an owner while the review window remains open.

  • Every line on the invoice is rebuilt from interval data, tariff, and contract.
  • Findings are ranked by pesos at stake, with a clarification letter ready for CFE or your supplier.
Discuss this module
Cost and billing screen with invoice audit table and valued findings
Illustrative platform view. Demonstration data does not represent client performance.

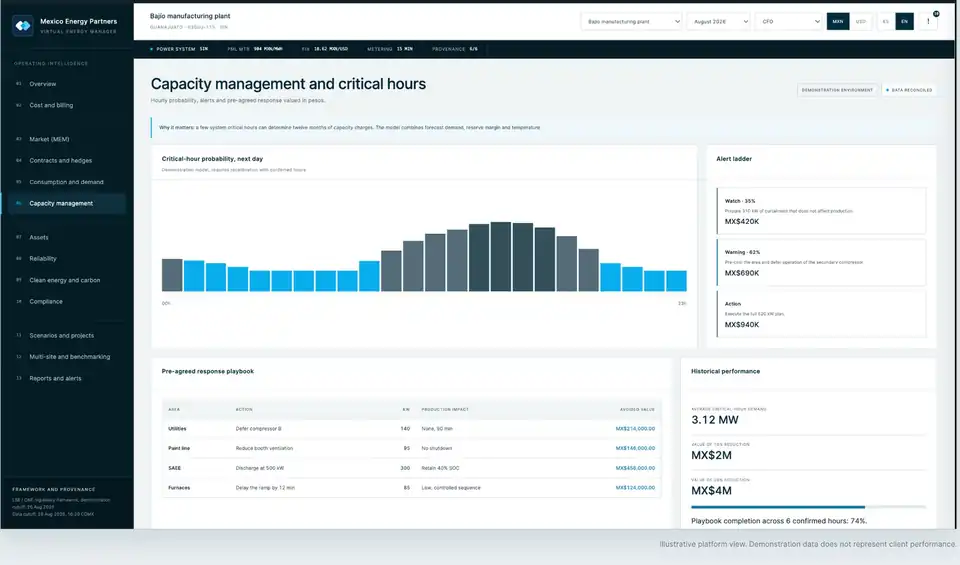
Capacity management 2 / 4

Prepare for the hours that set annual cost

A few critical hours in the power system can set twelve months of capacity charges. Track demand headroom and next-day critical-hour probability, and agree on plant responses in advance. Each response shows the kW it frees and the production it costs.

  • Alerts escalate from watch to warning to action as probability rises.
  • Each plant area signs off on its response before the hour arrives, not during it.
Discuss this module
Capacity management screen with critical-hour probability chart and alert ladder
Illustrative platform view. Demonstration data does not represent client performance.

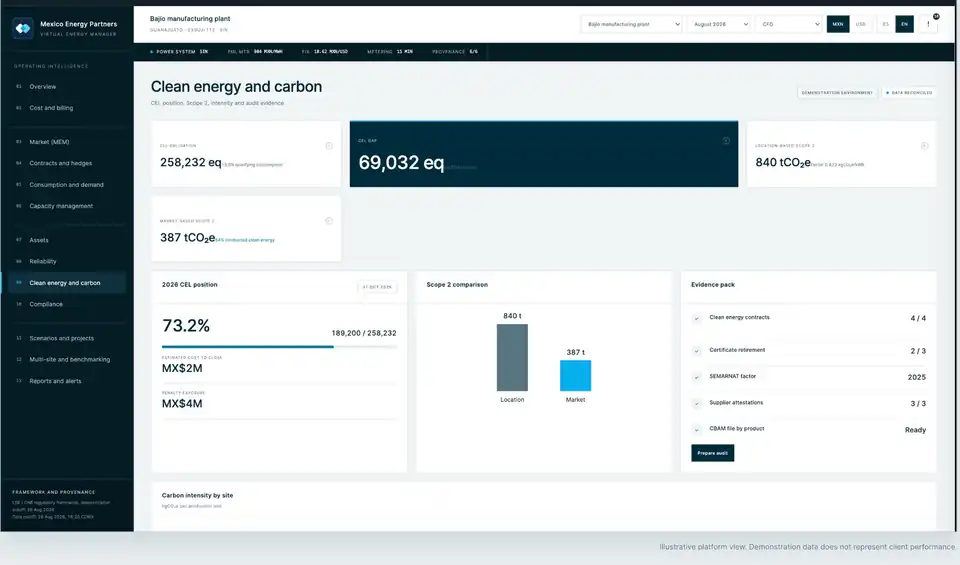
Clean energy and carbon 3 / 4

Keep every emissions figure audit-ready

Track your CEL position, Scope 2 under both location-based and market-based methods, and carbon intensity by site. Every figure links to the contract, certificate, or emission factor behind it.

  • Location-based Scope 2 uses the current SEMARNAT grid factor. Market-based uses your contracts and certificates.
  • The evidence pack is ready when an auditor or an export customer asks.
Discuss this module
Clean energy and carbon screen with CEL position, Scope 2 comparison, and evidence pack
Illustrative platform view. Demonstration data does not represent client performance.

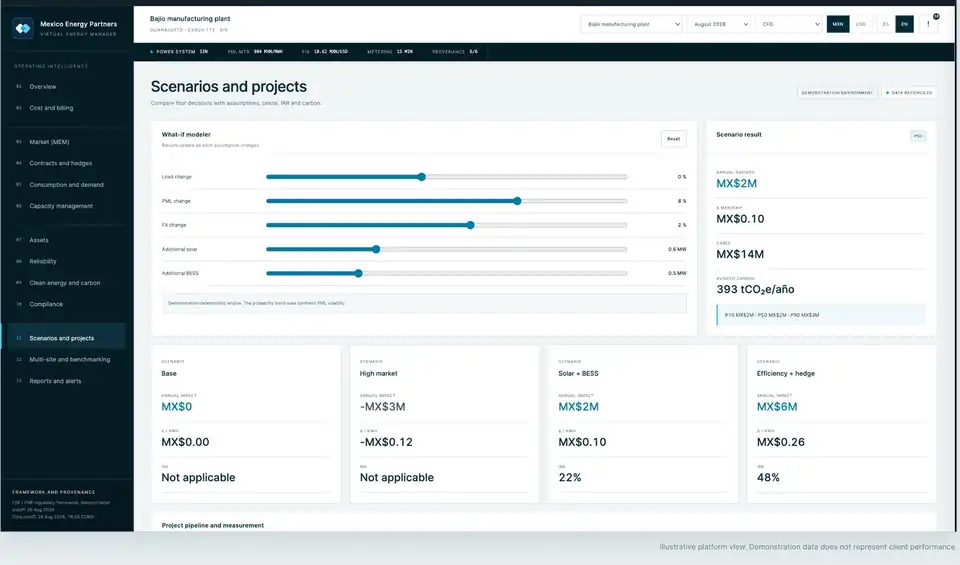
Scenarios and projects 4 / 4

Test the decision before capital moves

Change load, PML, exchange rate, solar, or storage, and see the annual impact in pesos. Compare options on cost per kWh, IRR, and avoided carbon. Then track the project you approve against measured results.

  • Every case runs on the same approved baseline, so finance and operations argue about the decision, not the data.
Discuss this module
Scenarios and projects screen with what-if sliders and scenario comparison
Illustrative platform view. Demonstration data does not represent client performance.

Each function gets the answer it is accountable for

A shared management record connects plant events, commercial exposure, and financial approval.

RoleDecisionManagement output
CFO and financeExplain budget variance and capital exposureCost bridge and forecast position
Plant managerResolve material operating varianceRoot cause, owner, and due date
ProcurementAct before load or contract exposure changesCommercial implication and decision calendar
HSE and sustainabilityMaintain an auditable performance recordNormalized indicators and evidence
Chief operating officerCompare risk and action across facilitiesPortfolio exceptions and accountability

Coverage grows from one site to the enterprise

We add sites only after the first one holds a monthly review with named owners.

Single-site oversight

One facility or a limited meter group

Review cadence
Monthly
Reporting
Site management summary
Includes
Bill, demand, intensity, and action review

Multi-site portfolio

Multiple plants and meter groups

Review cadence
Monthly with interim review
Reporting
Portfolio executive report
Includes
Benchmarking, procurement calendar, and consolidated exceptions

Enterprise portfolio

Enterprise-wide coverage

Review cadence
Agreed data cadence
Reporting
Executive and board reporting
Includes
Custom thresholds, escalation, and higher-frequency review

Prove control at one site in 90 days

A focused 90-day build establishes the baseline, thresholds, owners, and monthly closure process.

  1. Data map

    Days 1 to 15

    Bills, meters, owners, and gaps

  2. Baseline

    Days 16 to 30

    Approved indicators and tolerance

  3. Controls

    Days 31 to 60

    Bill tests, thresholds, and actions

  4. Cadence

    Days 61 to 90

    Memo, owners, and monthly closure

What the first engagement covers

Do we need a complete metering system before starting?

No. One recent electricity bill is enough to start. In the first 15 days MEP maps the meters, interval data, and owners you already have, and flags a gap only when it blocks a decision that matters.

Can the platform work with our existing SCADA, BMS, or meters?

Yes. The platform reads revenue meters, SCADA, BMS, and MQTT points through authenticated connections. Where no live feed exists, it works from interval files and invoices until one is justified.

Does it cover both basic supply and qualified supply?

Yes. MEP reconstructs bills for CFE basic supply and for qualified supply contracts in the wholesale market, including capacity, transmission, CEL, and supplier margin.

Who normally owns the program?

Finance or operations usually sponsors it, with a named owner at each plant. MEP runs the monthly review, prepares the management memo, and tracks each action to closure.

Send one bill. We will show you where the cost starts.

MEP reviews one recent electricity bill against your tariff and contract. Within two business days, you learn whether a full monitoring and management review is worth doing, and why.

Tell us where to focus

Six questions. No technical preparation required.